


Nifty & Bank Nifty Analysis: 18 Aug Recap & 19 Aug Strategy
Key Takeaways
- Both indices showed strong gap-up openings, but profit booking dominated the second half.
- Bank Nifty surged past 56,100 before correcting sharply to 55,700 levels.
- Nifty hit resistance at 25,040 and slid back near 24,880 zone.
- Volatility spiked intraday, indicating nervousness among traders ahead of global cues.
Price Action Breakdown (Nifty and Bank Nifty)
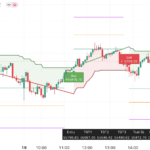
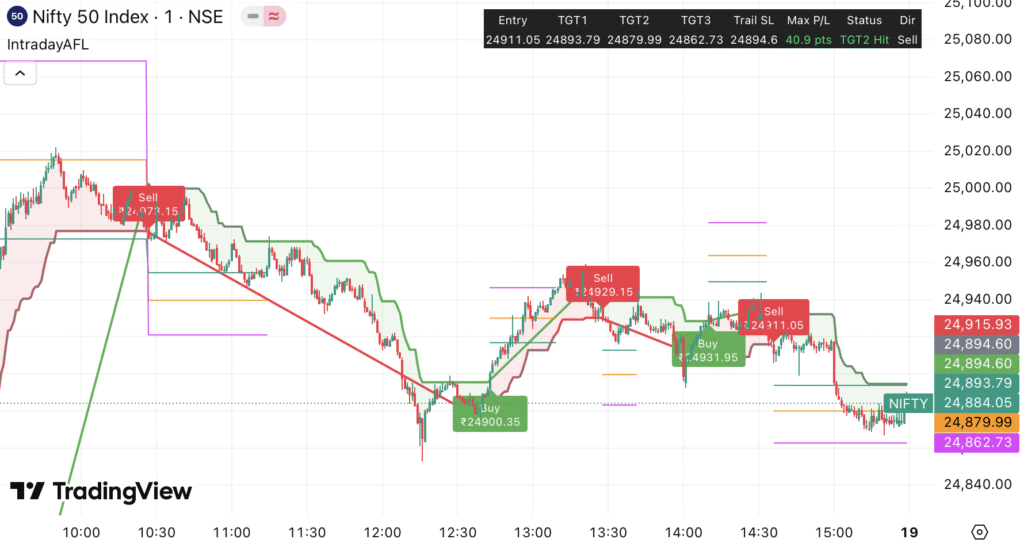
Nifty 50: The index opened with strength and briefly touched the 25,040 mark. However, sellers took over during mid-session. A bearish engulfing pattern emerged on the 5-min chart. It closed near 24,884. Watch the 24,800 level as immediate support.
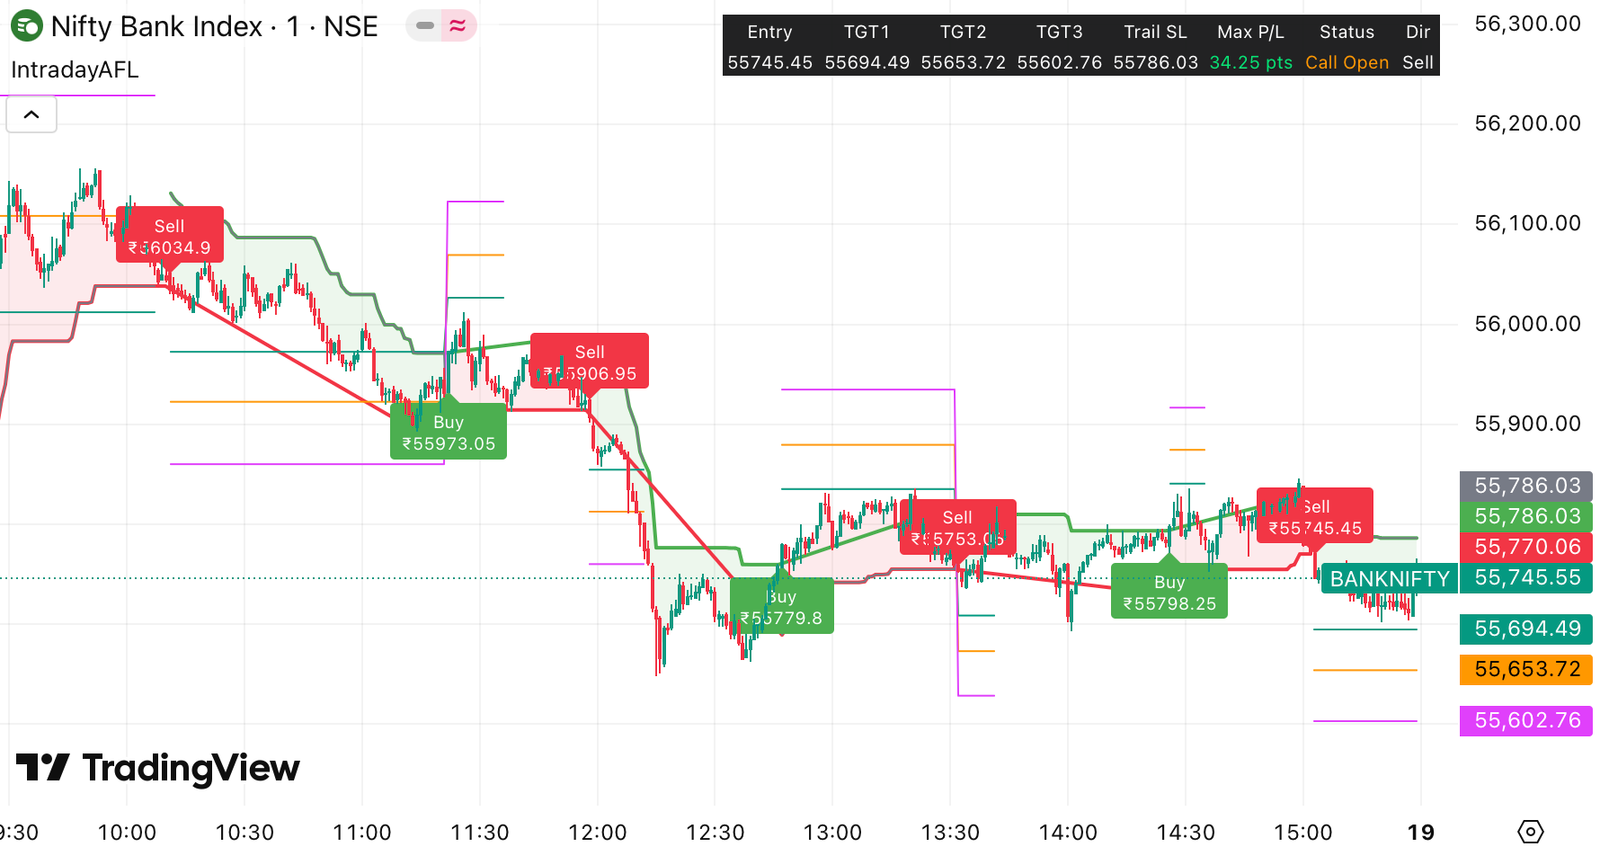
Bank Nifty: A massive gap-up rally took Bank Nifty above 56,100. But the index gave up most of its gains. It retraced to 55,700 and closed at 55,745. This signals a rejection at higher levels. Intraday volatility offered good opportunities for scalpers.
Global Market and Macro Updates
- Asian markets remained mixed ahead of the US Fed speech. [Source]
- US bond yields edged higher, pressuring global equities. [Investing.com]
- Crude oil prices stayed flat around $83/barrel. [FXStreet]
Technical Indicator Table
| Index | RSI (14) | India VIX | Put-Call Ratio (PCR) |
|---|---|---|---|
| Nifty 50 | 61 (Neutral) | 12.86 (Slightly High) | 0.96 (Balanced) |
| Bank Nifty | 58 (Neutral) | – | 0.91 (Slightly Bearish) |
Sector Performance Table
| Sector | Performance |
|---|---|
| IT | +1.2% |
| Banking | +0.5% |
| Auto | -0.3% |
| FMCG | +0.8% |
| Metal | -0.9% |
Trading Strategy for 19/8/25 (Intraday + Swing)
Intraday:
- Nifty: Watch for a breakout above 24,950 or breakdown below 24,820. Use tight stop-loss.
- Bank Nifty: Immediate resistance at 55,950. Breakdown below 55,600 could trigger short trades.
Swing:
- Nifty: Closing below 24,800 could indicate a short-term top formation. Consider short positions with 24,680 as the target.
- Bank Nifty: Bearish divergence seen. Hold short bias below 56,000 on daily closing.
Also, check out our Free Buy-Sell Chart and TradingView AFL Indicator for live signals.
Key Levels Table
| Index | Support | Resistance |
|---|---|---|
| Nifty 50 | 24,800 | 25,050 |
| Bank Nifty | 55,600 | 56,050 |
Final Thoughts
Markets showed signs of exhaustion after a strong gap-up. Traders must be cautious with overnight positions. Use strict risk management. Macro events and global cues may trigger volatility. Wait for confirmation before taking directional trades.
Disclaimer
This analysis is for educational purposes only. We are not SEBI registered advisors. Please consult your financial advisor before investing or trading.